
YouTube RPM 2026: Benchmarks by Niche, Country & Format
Compare 2026 YouTube RPM benchmarks from real creator analytics, understand how niche and audience geography influence revenue, separate long-form from Shorts, and learn why RPM is the creator-side metric that matters more than headline CPM.
What is a good YouTube RPM in 2026?
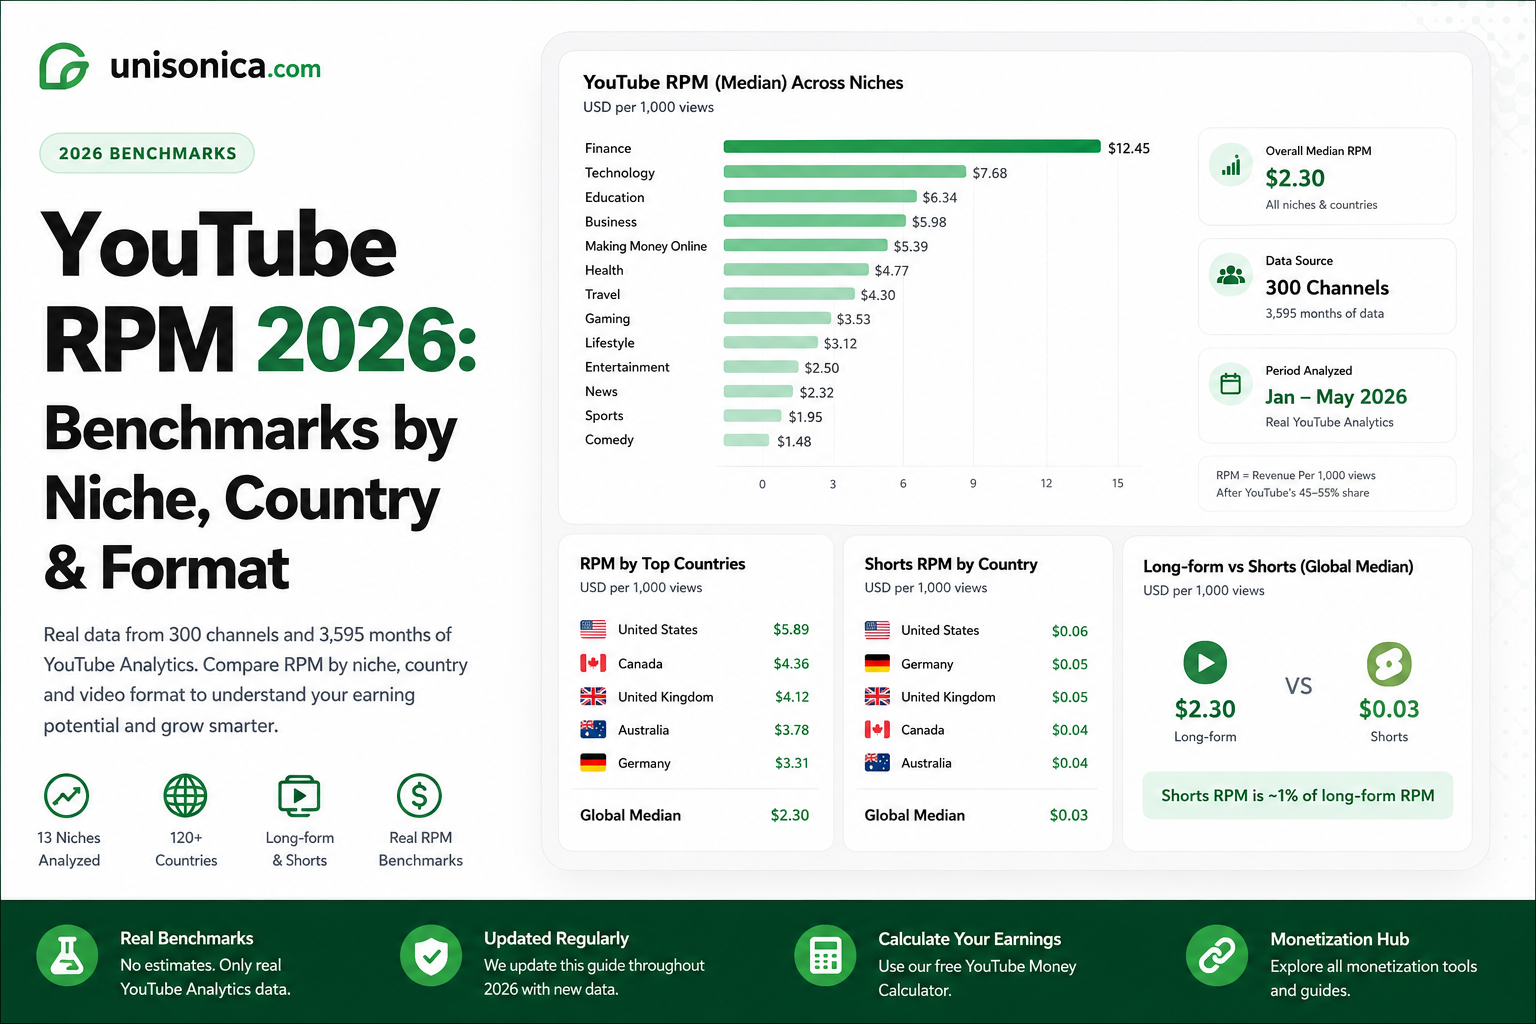
There is no universal “good” YouTube RPM. In AIR Media-Tech’s 2026 analysis of 300 monetized channels, the all-niche median was about $2.30 per 1,000 views. But the spread inside individual niches was huge: Education & Science had a median RPM of $10.22 with a middle-50% range of $2.31–$19.50, while Gaming had a $2.05 median with a $0.70–$3.62 middle-50% range. The useful benchmark is therefore not one internet average—it is your own recent YouTube Studio RPM compared with channels, formats and audience markets that resemble yours.
What YouTube RPM actually measures
RPM is a creator-side revenue metric. It answers a different question from CPM and is the better starting point for estimating channel income.
RPM = revenue per 1,000 views
YouTube defines RPM as the amount a creator earns per 1,000 views after YouTube’s revenue share. For standard videos, RPM includes all video views—including views that did not monetize. It can include revenue from ads, YouTube Premium, channel memberships, Super Chat and Super Stickers. For Shorts, YouTube calculates RPM per 1,000 engaged views used for Shorts ad-revenue sharing.
Simple planning formula
Estimated revenue ≈ Views ÷ 1,000 × RPM.
At a $2.30 RPM, 100,000 views would model to about $230 and
1 million views to about $2,300. This is arithmetic, not a payout
promise—your actual RPM can move materially by month, format and audience.
YouTube RPM benchmarks by niche in 2026
AIR Media-Tech analyzed real YouTube Analytics from 300 monetized channels across 13 niches, covering 3,595 monetized channel-months. The figures below are medians, not averages. Transport, News & Politics, Food & Cooking, and Business & Finance had fewer than ten channels and should be treated as directional.
| Niche | Median RPM | P25–P75 range | Median Studio CPM | Approx. views for $1,000 |
|---|---|---|---|---|
| Education & Science | $10.22 | $2.31–$19.50 | $5.91 | ~98K |
| Transport directional | $5.69 | $3.17–$9.81 | $5.88 | ~176K |
| Lifestyle | $2.98 | $1.77–$5.24 | $5.32 | ~336K |
| News & Politics directional | $2.60 | $1.79–$3.62 | $4.51 | ~385K |
| Entertainment | $2.43 | $0.88–$5.02 | $3.98 | ~412K |
| Crafting & Handmade | $2.39 | $1.00–$3.90 | $3.42 | ~418K |
| Gadgets & Tech | $2.33 | $0.70–$3.71 | $5.73 | ~430K |
| Music | $2.28 | $1.35–$4.16 | $4.05 | ~439K |
| Food & Cooking directional | $2.25 | $1.50–$3.11 | $4.04 | ~445K |
| Gaming | $2.05 | $0.70–$3.62 | $4.05 | ~487K |
| Business & Finance directional | $2.01 | $0.73–$5.17 | $4.84 | ~498K |
| Health & Sport | $1.23 | $0.72–$1.53 | $3.54 | ~810K |
| Kids & Teens | $0.33 | $0.16–$0.88 | $1.59 | ~3.01M |
These are third-party medians from one large creator network, not official YouTube payout schedules. Your own Studio RPM is the stronger benchmark once you have enough recent data.
AIR’s 2026 dataset found major channel-to-channel variation inside the same category. Education & Science ranged from $2.31 at the 25th percentile to $19.50 at the 75th percentile—an 8.4× spread. Gaming ranged from $0.70 to $3.62, and Entertainment from $0.88 to $5.02. That is why switching niches based on a single RPM chart is usually a weaker decision than first understanding your audience geography, monetized-playback rate, ad load, video format and revenue mix.
Why your YouTube RPM is usually lower than CPM
YouTube’s own documentation separates these metrics clearly. RPM is creator revenue after the revenue share; CPM is advertiser spending before the creator revenue share.
RPM — creator-side revenue
RPM divides your reported channel revenue by total views. It includes views that did not show an ad and can include several revenue sources. That makes RPM the more useful metric for planning what your audience actually earns per 1,000 views.
CPM — advertiser-side cost
CPM measures what advertisers pay per 1,000 ad impressions before YouTube’s revenue share. Playback-based CPM is tied to monetized playbacks, not every video view. A high CPM therefore does not automatically translate into a high RPM.
AIR’s 2026 niche dataset shows a $5.73 median Studio CPM for Gadgets & Tech but a $2.33 median RPM. One reason is monetization coverage: AIR reported that only 34% of views in that niche’s sample were monetized playbacks. A strong advertiser rate can still produce a modest RPM when many views never serve an ad.
YouTube RPM by country: use geography carefully
Audience location matters because advertiser demand is not equal across markets. But a reliable long-form country table is often published as CPM, not creator RPM. The figures below are AIR’s public 2025 CPM benchmarks and should be treated as advertising-demand context—not as 2026 RPM promises.
| Audience country | Average CPM | Audience country | Average CPM |
|---|---|---|---|
| United States | $14.67 | United Kingdom | $8.91 |
| Australia | $13.30 | Netherlands | $8.62 |
| Switzerland | $12.98 | France | $6.76 |
| Norway | $11.21 | India | $0.74 |
| Canada | $9.93 | Algeria | $0.58 |
| Germany | $9.79 | Pakistan | $0.53 |
RPM also depends on how many views monetize, the number and type of ads served, YouTube’s revenue share, Premium and fan-funding revenue, seasonality, format and your channel’s own audience behavior. Use YouTube Studio’s geography and revenue reports for your real answer.
YouTube Shorts RPM and long-form RPM are different economies
Shorts Feed revenue is pooled and allocated differently from Watch Page revenue. Forecast the formats separately instead of applying one RPM across an entire mixed-format channel.
Long-form / Watch Page
Long-form videos can earn from Watch Page ads and YouTube Premium, and longer eligible videos may create additional mid-roll opportunities. YouTube says creators who accept the Watch Page Monetization Module receive 55% of net ad revenue from eligible public Watch Page content.
Shorts Feed
Shorts Feed ad revenue is pooled into a Creator Pool and allocated based on eligible engaged views. YouTube says monetizing creators keep 45% of the revenue allocated to them. AIR’s 2026 study across 274 channels found Shorts RPM at roughly 3–14% of long-form RPM in most niches.
| Shorts audience country | Reported Shorts RPM | Approx. direct revenue per 1M engaged views |
|---|---|---|
| United States | $0.328 | ≈ $328 |
| Australia | $0.193 | ≈ $193 |
| United Kingdom | $0.166 | ≈ $166 |
| Canada | $0.165 | ≈ $165 |
| Germany | $0.163 | ≈ $163 |
Direct Shorts revenue is only one part of the strategy. Shorts can introduce viewers to a channel and feed discovery, while long-form content may capture substantially more revenue per view. The right mix depends on your own audience behavior, production cost and conversion from Shorts viewers into long-form viewers.
Six factors that can change your YouTube RPM
Audience geography
Advertiser demand changes by viewer market. A US-heavy audience can monetize very differently from a globally mixed audience even when the content niche is identical.
Monetized-playback rate
Not every view shows an ad. AIR’s 300-channel study reported a median monetized-playback rate of about 53%, with large differences between niches.
Video length and ad opportunities
Eligible longer videos can create natural mid-roll opportunities, but retention and viewer experience still matter. More ad slots are useful only when people keep watching.
Niche and viewer intent
Commercial intent can affect advertiser bids, but the variation inside a niche can be larger than the difference between two niches.
Seasonality
Ad budgets often strengthen in Q4 and reset after the holiday period. A changing RPM does not automatically mean your content quality changed.
Revenue mix and suitability
RPM can include ads, Premium and fan-funding revenue. Advertiser suitability can affect ad demand, while memberships and Supers can move total RPM independently of ad CPM.
How to forecast your own YouTube earnings without false precision
Benchmarks are most useful when they become a temporary starting point—not a substitute for your own Studio analytics.
Separate formats
Forecast long-form and Shorts separately. Their revenue mechanics and RPM ranges are too different for one blended assumption to be useful.
Use a recent period
Start with the last 28–90 days, then compare with the same period last year if your channel has enough history to expose seasonality.
Use your real Studio RPM
Once you have enough revenue history, your own channel RPM should take priority over a generic niche median.
Check geography
Compare your top viewer countries with revenue by geography. A changing audience mix can move RPM even when views stay flat.
Build a range
Model lower, base and upper cases rather than treating one RPM number as a guaranteed result.
Recalibrate monthly
Replace assumptions with actual views and RPM as new Studio data arrives. The model should become more personal over time.
Use the Unisonica YouTube Money Calculator to enter monthly views and RPM, compare earnings scenarios, reverse-calculate the views needed for a revenue goal, and use supported public channel signals for planning context. Public channel data cannot reveal another creator’s private RPM or revenue.
YouTube RPM questions, answered
What is the average YouTube RPM in 2026?
YouTube does not publish one official platform-wide average. AIR Media-Tech’s 2026 dataset of 300 monetized channels reported an all-niche median of about $2.30 per 1,000 views, with large variation by channel and niche.
What is a good YouTube RPM?
A good RPM is one that is healthy relative to your own recent history, format, audience geography and comparable content. Public niche medians are context, not a target YouTube guarantees.
Why is my YouTube RPM lower than my CPM?
RPM is calculated after YouTube’s revenue share and includes all video views, including views that did not monetize. CPM measures advertiser cost per 1,000 ad impressions before the creator revenue share.
Does audience country affect YouTube RPM?
Yes. Advertiser demand varies by viewer market, which can change revenue materially. But a country CPM table is not automatically a country RPM table. Use your own YouTube Studio geography reports for the strongest channel-specific answer.
Do Shorts have a lower RPM than long-form videos?
In AIR’s 2026 study of 274 channels, Shorts RPM was roughly 3–14% of long-form RPM in most niches. The formats use different monetization systems, so they should be modeled separately.
Does having more subscribers increase RPM?
Not automatically. RPM is a per-view metric. AIR’s 2026 analysis found little consistent RPM advantage from channel size alone. More subscribers can increase total views and revenue without making each view more valuable.
Can I estimate another creator’s RPM from public channel data?
No. Public views, subscribers and upload counts do not expose private YouTube Studio RPM, audience geography, monetized-playback rate, ad load or exact revenue mix. Public data can support context, not reliable private-income claims.
Where the definitions and benchmark data come from
Official YouTube sources are used for metric definitions and revenue-share rules. Third-party benchmark studies are labeled clearly and should be treated as context rather than official rates.
The best YouTube RPM benchmark is your own recent Studio history.
Start with a real public benchmark when you need context, then replace it with your own RPM as soon as enough channel data is available. That gives you a forecast built around your actual audience, format, seasonality and revenue mix.